UK Housing Market (The problem/The goal)
QOMPLX, through its Q:SIM product, which provides tools and analysis to allow customers to run various simulations and models, aimed to study the possible effects of macro-prudential policies, including nine key housing market indicators monitored by the Bank of England’s Financial Policy Committee. This model allows capturing and analyzing particularities to assess different scenarios, seek dynamic equilibrium points, predict the evolution of market indicators, etc. and understand relationships between macroeconomic variables that emerge from the interaction of the participants of the micro-level economy.
Some key Q&A this model can help with are:
- How do policy changes impact individual (entity) behavior/metrics?
- How do policy changes affect housing market indicators?
- How do policy changes affect broader macroeconomic indicators?
Our goal was to verify that an increase in the size of the buy-to-let sector may amplify house price cycles and increase house price volatility.
The Model - How To
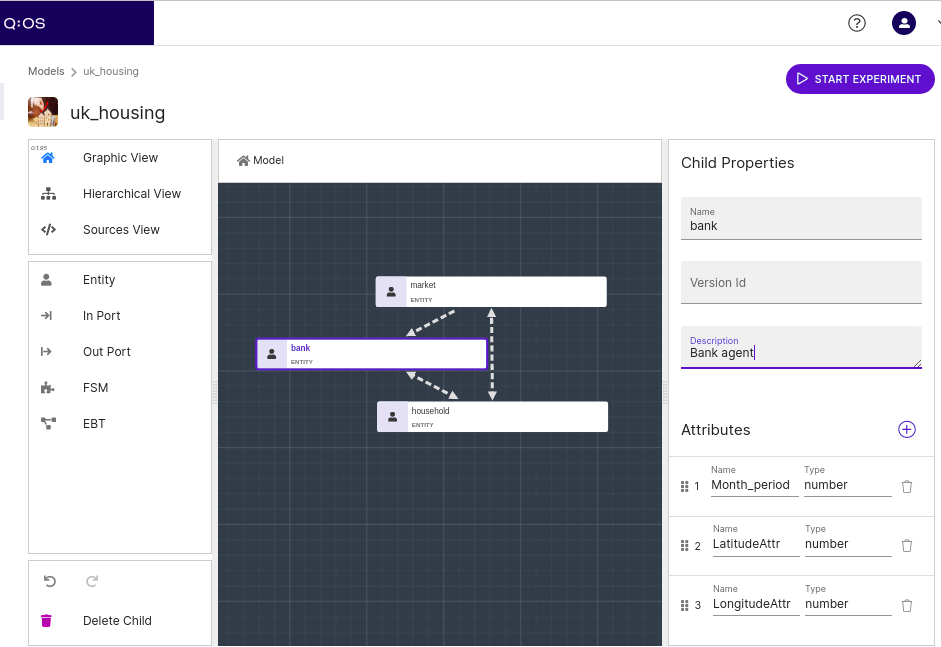
There are multiple entities in this model, or system: First-time buyers, homeowners, buy-to-let investors, and renters, financial institutions, etc. We are looking to observe the aggregate dynamics in the property and credit markets, resulting from the behaviors of these entities over time, as affected by macro policy changes.
An Agent-Based Bottom-Up modeling approach
Each entity is represented by an agent having its own behavior and interactions with other agents.
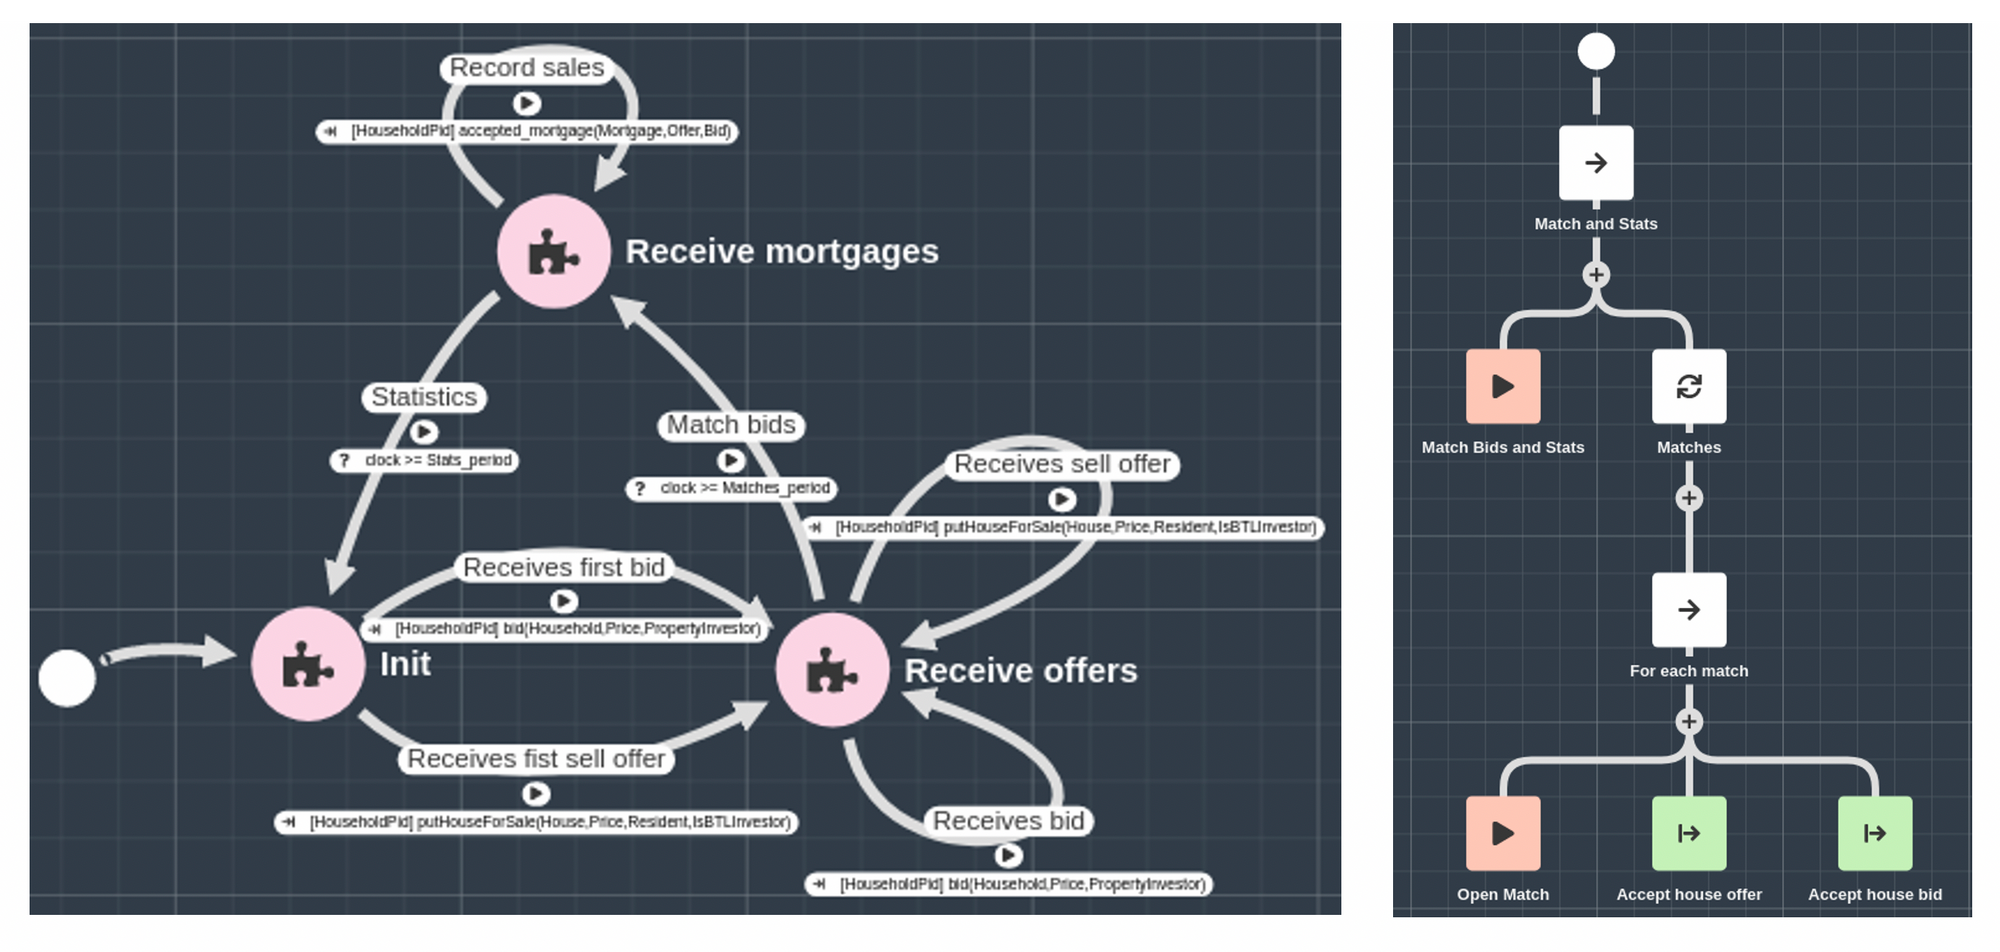
Behaviors are implemented using a Finite State Machine (FSM) with clocks where state transitions a graphical modeling notation called Enhanced Behavior Trees (EBT).
The Market agent
Represent a kind of a broker where transactions are evaluated and executed. It takes the offers of the owners (households) and matches them with the offers of the householders who want to buy. Once paired, it informs the bank, the seller, and the buyer, and records the sale
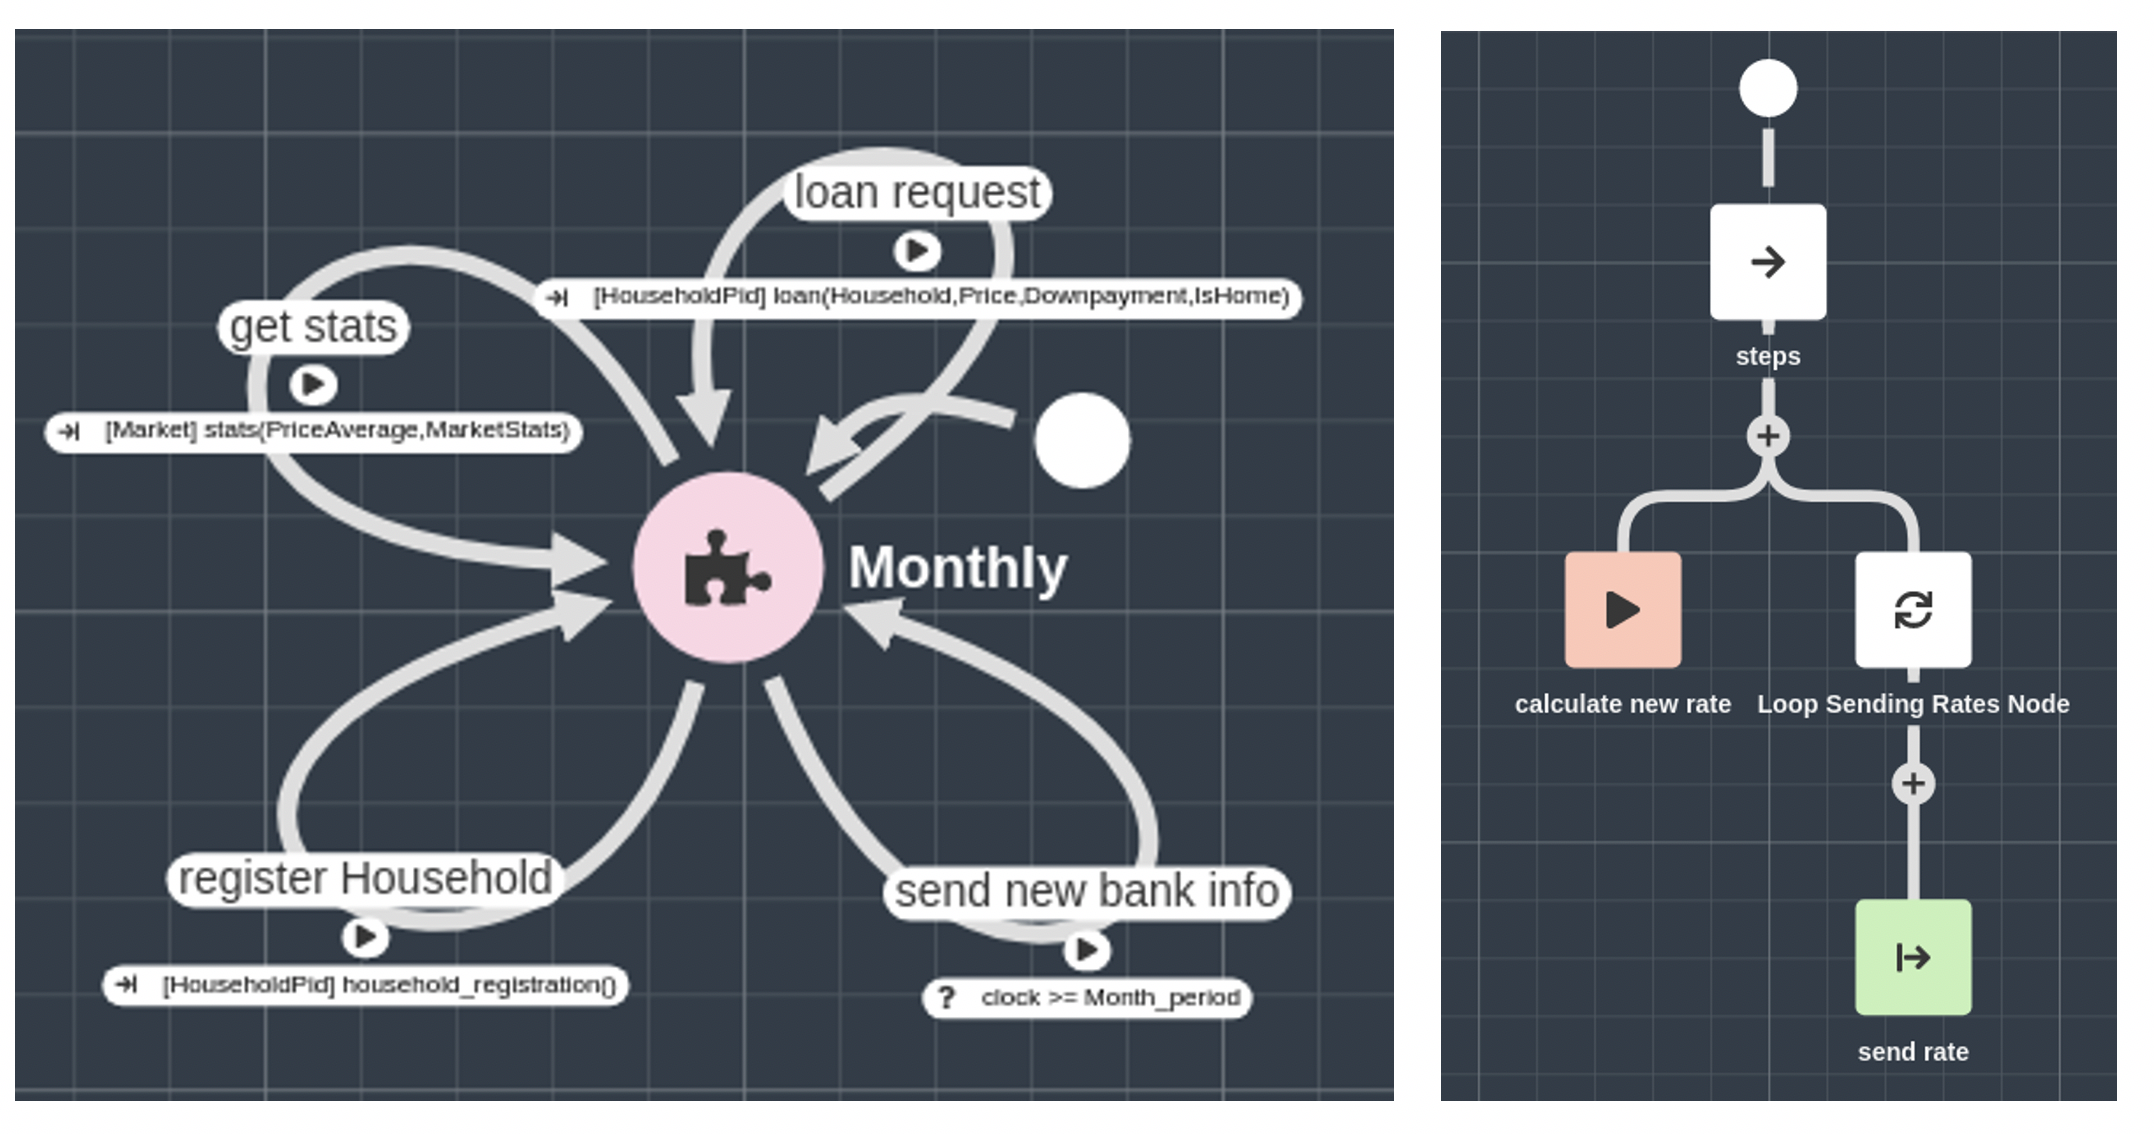
The Bank agent
Once a transaction is approved, if the buyer needs a loan, he asks the bank for it, and it evaluates and grants it based on the applicant's income. It also calculates statistics that affect the macro behavior of the run.
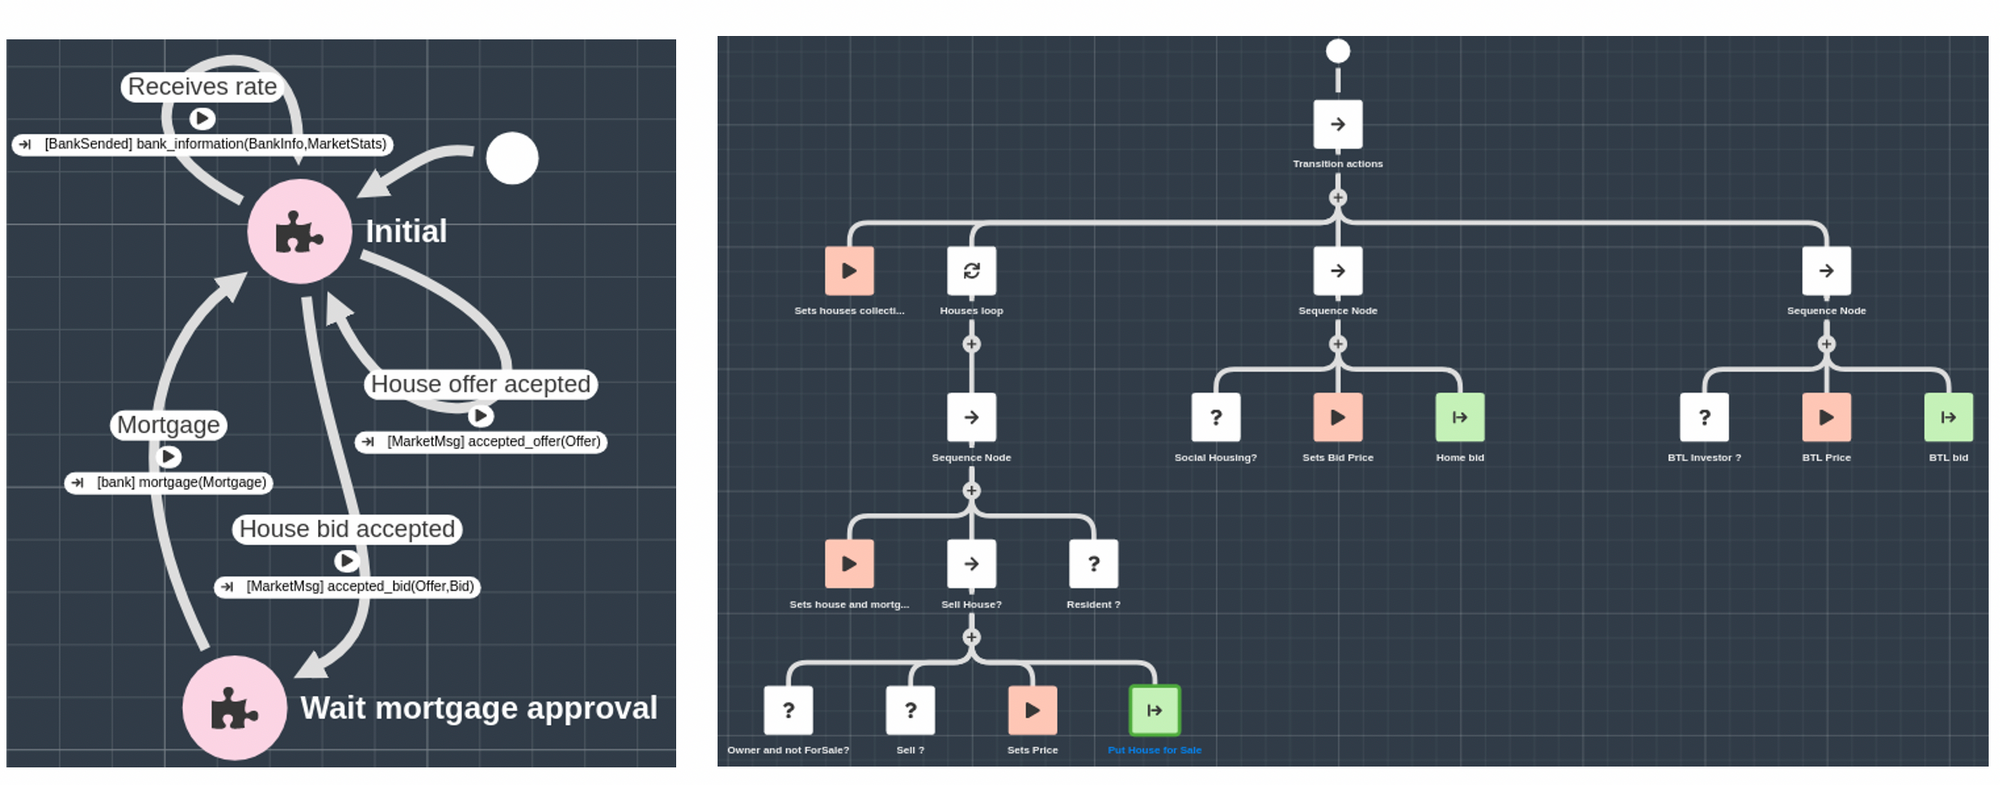
The Household agents
Simulation Results and Conclusions
User-defined Dashboards allow building line charts from the experiments simulation results to make comparisons and analysis. Two simulation experiments were executed by varying the BTL investor input parameter of the Households, thus impacting the buy to let market. The Dashboard on the left corresponds to the lower size of the buy to let market while the one on right to the higher.
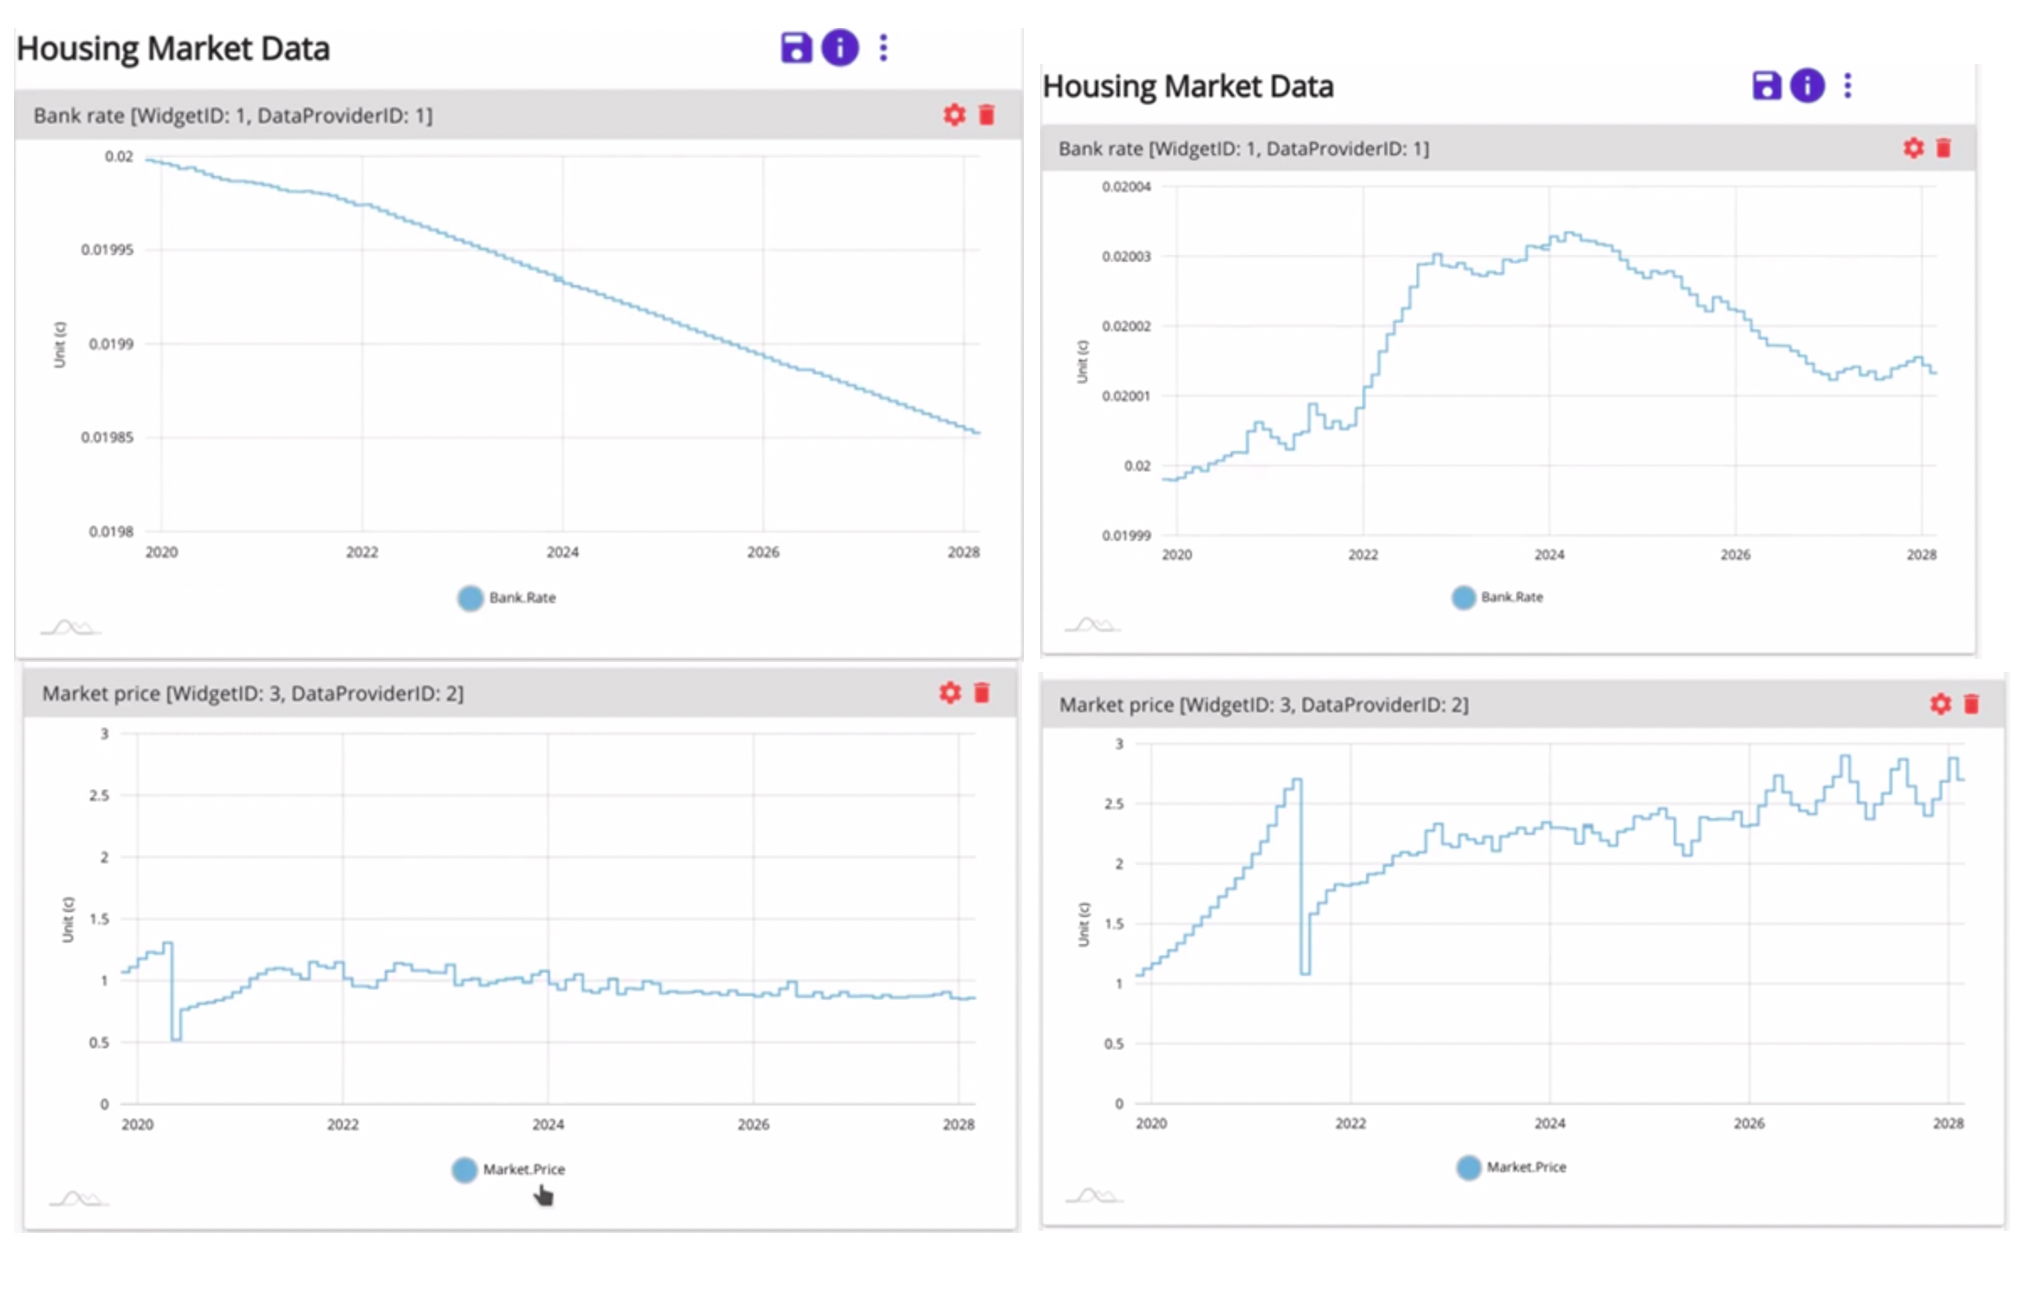
On the upper-left dashboard, one can see the results of the Bank rate and the market price for a low investor ratio of the market; it is stable. While on the above right dashboard the same market but with high investment in the buy-to-let market is shown; it has cycles and it is unstable. These results are intuitive but not reachable with classical tools. This tool allows us to understand and correlate the interactions at a micro-level with the macro results observed in real markets.
Our goal of verifying that an increase in the size of the buy-to-let sector may amplify house price cycles and increase house price volatility is achieved.

